


Website navigation analysis – 5 easy ways to improve website navigation
In this article, we'll show you a few not-so-obvious Google Analytics reports and filters. These tricks will help you optimise your customer journey and navigation for desktop and mobile devices.
Written by Dawid ZimnyKey takeaways
- Before worrying about your navigation, check your landing pages and traffic sources in GA4. This helps you understand where people are coming from.
- Use explorations in GA4 to trace the exact user journeys people take across your site.
- Analyse mobile vs. desktop user journeys, as you might need to adjust your navigation between these devices.
You’ll learn how to find information about how to access the following stats by using just GA4:
- the percentage of visitors that abandon a page
- how people land on your website
- what are their first steps
- which critical pages are lacking engagement
- how visitors use different types of website navigation
This will give you a complete overview of the sales funnel on your website. You’ll be able to compare the data with your expected outcome and requirements to optimise the user journey and increase sales.
1. Landing page report in GA4
Website navigation starts before the visitor lands on one of your pages. Breaking down the traffic sources and types will help you estimate the performance of your Google search results, paid advertising campaigns, and other sources.
Verifying the referrers is crucial at this stage. We often come across “fake traffic” that skews your data and needs to be blocked. When using the report outlined below, look for unusual traffic sources that need to be excluded.
Here are the steps to finding out more about your landing page traffic.
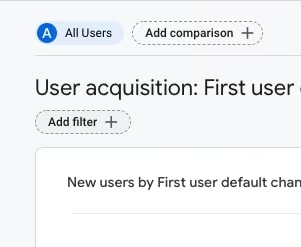
1. In the left panel, navigate to the Life cycle section, then expand the Acquisition tab and click on User acquisition.

2. Click on Add filter above the graph.
3. In the right panel, search for the “Landing page” dimension and then select the desired page from the Dimension values. Remember to click “Apply” in the bottom right.
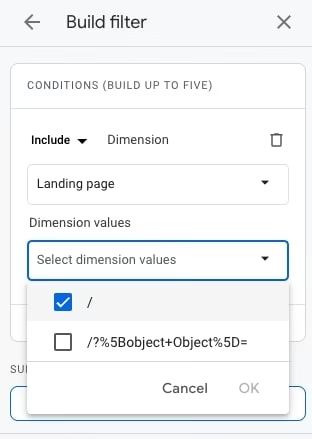
You’ll see the final report:
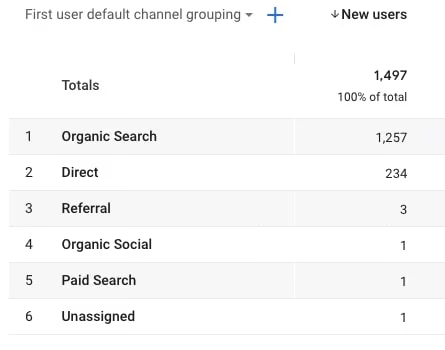
You can change the “default channel grouping” to another report – we’ll describe the differences later on.
2. Secondary dimensions for the site navigation view
Traffic type
In the above case, we have selected “Traffic type” as the secondary dimension. The traffic types are:
- social – links clicked on social media
- organic – visits from various search engines
- paid – visits from various pay-per-click campaigns
- referral – other websites linking to your landing page
- direct – directly inputting the specific URL in the browser, using the browser history or bookmarks
Medium
Choosing “Medium” shows the same categories, minus “social”, with a few different names and one major advantage. It saves “Paid” traffic as “cpc” (cost per click, paid search) and direct traffic has a medium of “none”.
The advantage is being able to specify the medium type in UTM parameters of your URLs. For example, going to the main page of our blog from the following URL will display the medium as “navigationblog” in Analytics – https://nerdcow.co.uk/blog/?utm_medium=navigationblog.
Source
The “Source” dimension provides a more detailed look at the domains of your referrals. Search engines will still display as simply “google” or “bing”. However, you will start seeing URLs of the referring domains, such as “facebook.com”, linkedin.com” or even their shortened versions like “linked.in”.
Best of both worlds – Source/Medium
We display data in a comprehensive, yet easy-to-read manner. It’s crucial in B2B communication and for our internal operations. The “Source/Medium” splits the traffic according to the categories of both individual groups and displays them right next to each other.
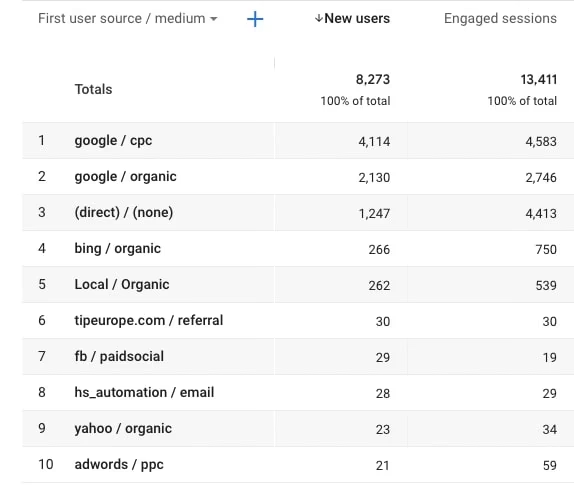
This helps you understand how each source drives traffic to your site. When all the other filters could only show that X amounts of visits were paid traffic, or Y came from Google, the “Source/Medium” shows exactly how much of your paid traffic came from Google and how different search engines contribute to the organic visits.
3. Who navigates your website
The way a visitor finds your business gives you invaluable insights into their needs and how far in your sales funnel they are. You’ll notice several differences between each traffic source. One example would be that paid advertising sessions are likely to be shorter and with a higher bounce rate.
This fact alone won’t be a red flag, but it will change your approach to the navigation analysis. If you’re offering a range of services, you can’t expect that a highly targeted PPC visitor will be interested in the solutions unrelated to the ad that made them visit your website.
Learn from our website navigation mistakes
Even a web design agency makes navigation mistakes! See how our team got to the bottom of them to improve the user journey on our website.
4. Find the navigation path of your users in GA4
Once you figure out who lands on your page, it’s time to evaluate whether visitors follow your intended customer journey.
You can use it to track the performance of any page – expanding the “Current Selection” will give you a list of some of your pages and a search box to help you quickly find the page you are looking for. In this case “/” means the home page.
On top of showing the “Previous Page Path” and “Next Page Path”, the report contains a few key statistics, such as the exit percentage for your page.
Google Analytics provides a number of ways to browse the behaviour flow of your visitors. The more advanced ones aren’t obvious to navigate, but thankfully there is a way to quickly check the most common previous (and next) steps for any given page.
1. Go to Explore in the left panel.
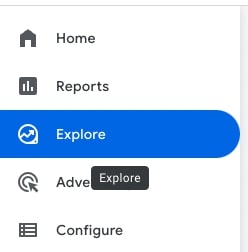
2. Pick Path exploration on the next screen.

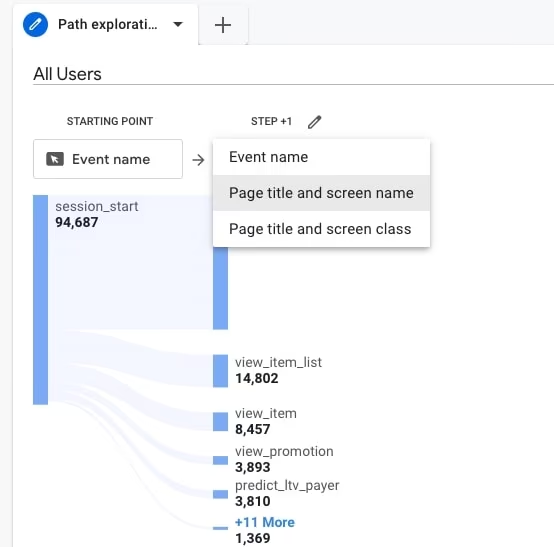
3. The next screen will be a little overwhelming, but for basic analysis, you only need to focus on the tree on the right. You’ll see the default view with the “session_start” event. From there, change the Event name under Step +1 column and choose Page title and screen name.
4. Once the tree loads, you’ll see a list of pages in the second column. This is where users start their sessions, with the most visited pages first. Simply find the desired first step (in our case, it was Home) and click on it to reveal the next column and the following pages in users’ journeys.
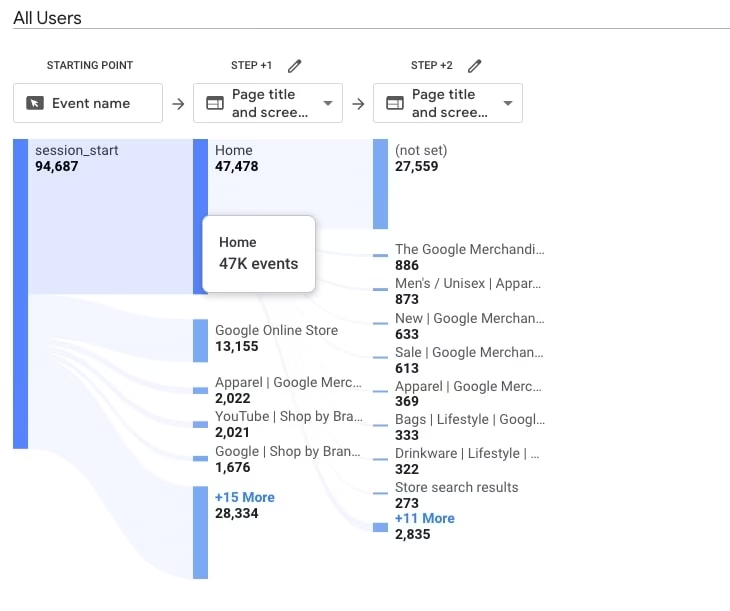
Continue this for as long as you need to find out how users navigate your site. In our example, we can see that men’s unisex merchandise is quite popular. We can go in there to find out which products attract the most clicks, and so on.
5. Mobile website navigation statistics in GA4
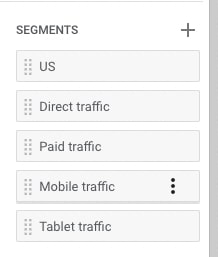
You can test the navigation on mobile, desktop or specific mobile devices. In the Path Exploration, simply go to Segments on the left, click the three dots next to an existing segment and hit “Apply”. You can also use the “+” button to add your own segment.
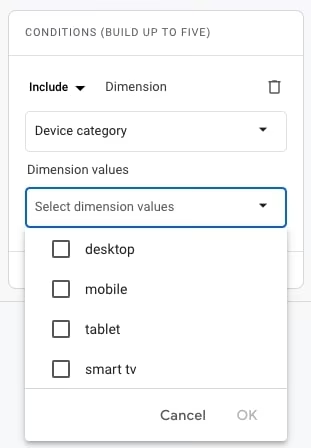
When using Reports (like in the first step of the guide), click on the “All Users” above your graph and use the right panel to change the filter. In this case, you’re looking for Device category. Then, click on the Dimension values to show a list of all the device types available in the filter. Choose the ones you want to analyse and click “Apply” in the bottom right.
Combine segments with other reports
We’ve highlighted the importance of the source of your traffic – so how do you incorporate it into the “Previous page” report” You can do it the same way we’ve filtered mobile traffic above. Simply search for the traffic type you want to compare and include it in your segments.
Why should you improve your website navigation?
You probably often ask yourself how can you help visitors find your products, services, or information?
The first thing they need is clear and concise website navigation. If they can’t immediately get an idea of what to expect from your website, they’ll leave for a competitor’s website and never come back. With a clear navigation path for users, not only will they convert better, but you’ll also start ranking higher in search engines and your paid advertising CPC will go down. Improving user experience metrics benefits your website across the board.
Even though Google Analytics makes a good job of making key metrics easily accessible, there are some useful reports that aren’t easy to find. We hope our quick guide helped you perform the basic analysis of your website navigation and customer journey.
Originally published 15th May 2019, updated 22nd July 2026.

