How to measure SEO performance without paid tools
You don’t need specialist tools to measure SEO. That’s how we started. Our organic traffic went from zero to a few hundred visits per month. Back then, we only used Google Search Console and Google Analytics. It’s the perfect combination for internal teams who need quick access to baseline data. Here’s how to use them right.
Written by Dawid ZimnyWhen should you measure SEO, and when should you not?
Writing articles and forgetting about them after clicking “publish” can work. We always preach that getting started is more important than being perfect.
Putting content out there, checking organic traffic in Analytics and calling it a day is valid. Doing so will teach you what works, and you’ll be able to build on that.
Doubling-down on the content topics will help you create topical clusters. These clusters further boost traffic for the articles that already work. And most importantly, early on in your SEO journey your resources will be scarce – you can’t afford to spend them on measurement if your blog only has a few articles on it.
On the other hand, without monitoring SEO, you won’t know why your content works. You might even encounter situations where the superficial data – impressions and clicks – looks good, but the underlying keywords bring completely irrelevant traffic to your site.
But with a combination of two free tools from Google, Search Console and Analytics, you can create SEO tracking workflows that you won’t outgrow for years.
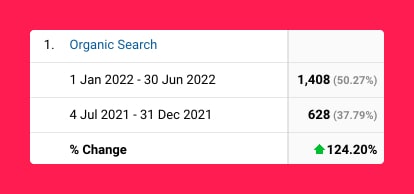
That’s exactly what we did in 2021, when our team more than doubled our organic traffic.
This is how we tracked our SEO progress.
1. We made SEO checks a recurring event
Our SEO monitoring schedule is set up using a TODO list. We never mark these as done. Instead, we constantly change the due date.
This allows us to maintain a log of comments from each historical SEO check. The simple setup made the knowledge available to everyone at our company.
We check our SEO results once a month. Doing it once a quarter is also an option. It depends on a few factors, including traffic numbers and how volatile it is.
There’s no rule of thumb, but we recommend monitoring SEO once a month. We tone it down to once every two or three months when it feels like there’s not much to learn month-by-month.
2. We track content trends and compare with historical data
From the TODOs, it’s straight into Google Search Console. It’s one of the best sources of first-party SEO data. ‘Nuff said.
We started with filters for each piece of content. You only need to set it up once.
After that, copying the unique Search Console link will remember your selection. Saving it in your TODOs and updates makes it even more convenient for subsequent checks.
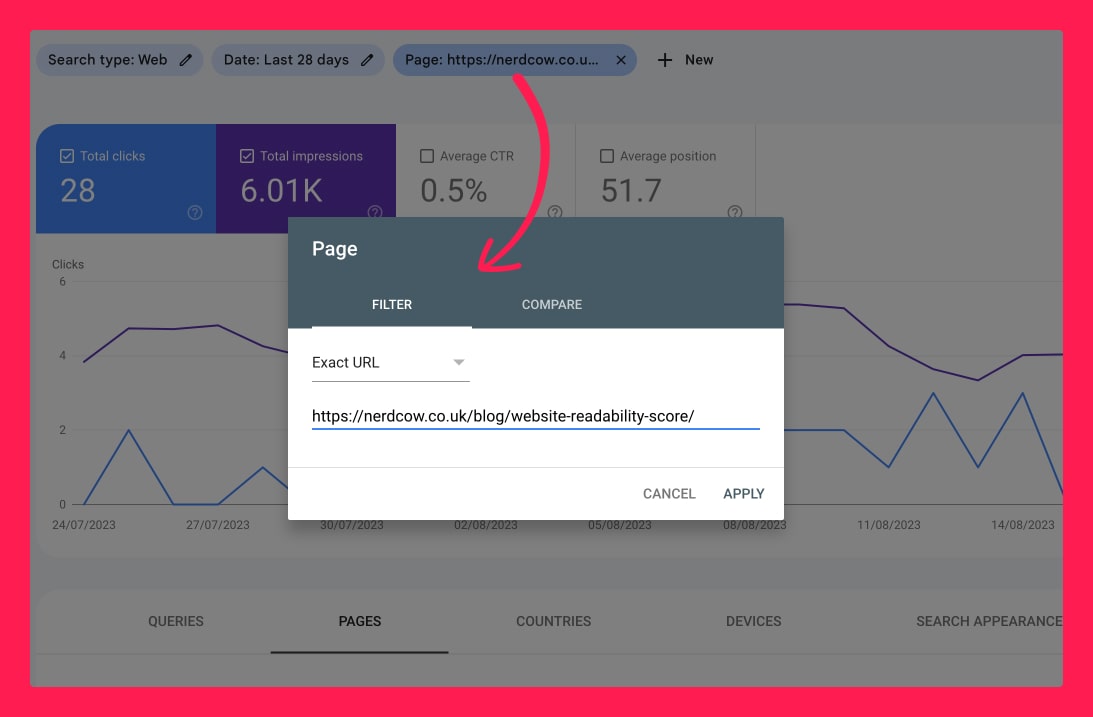
By default, we go for a comparison of the last 28 days and the previous 28-day period.
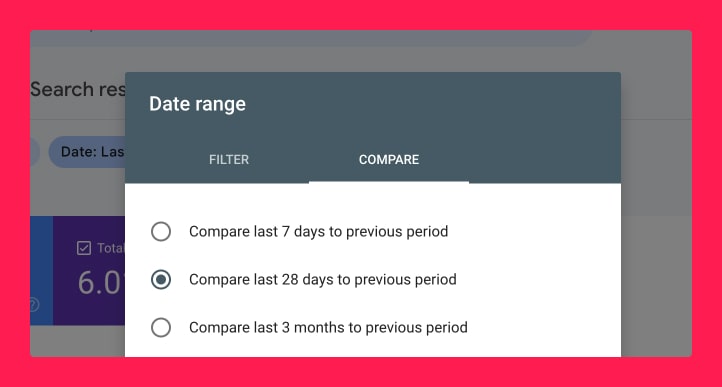
Another options we frequently check:
- Compare last 3 months to previous period
- Compare last 28 days/3 months year over year
- Last 3/6/12/16 months
These additional filters help us notice trends and spot seasonal traffic changes.
Note: Search Console doesn’t store data indefinitely
Unfortunately, it only goes back as far as its longest filter – 16 months. Because of that, older filters will not show the data you’re looking for.
To go further back, you’ll need to frequently send your Search Console data to an external database. This might be necessary if you want to track YoY data, e.g. for a seasonal business.
3. The SEO metrics we track
Revenue is the best SEO metric.
But we all know how tricky marketing attribution is these days. So what are the alternatives?
Clicks are the closest thing to revenue.
Engagement is equally as important. Especially for B2B companies, driving traffic can be a dangerous trap. It’s not that hard to get more organic traffic. What makes is tricky is getting qualified organic traffic. Without tracking conversions or engagement you won’t be able to say if you’re attracting the right audience. That’s where Google Analytics will help, but more on that later.
Impressions and rankings can be insightful if all else fails, but they’re often vanity metrics.
Starting with rankings, never analyse aggregate rankings. The position graph and your “average” position for a single page are useless. There’s just too much noise in the data, and the formulas for these values are flawed.
You should only take position seriously when looking at a single keyword.
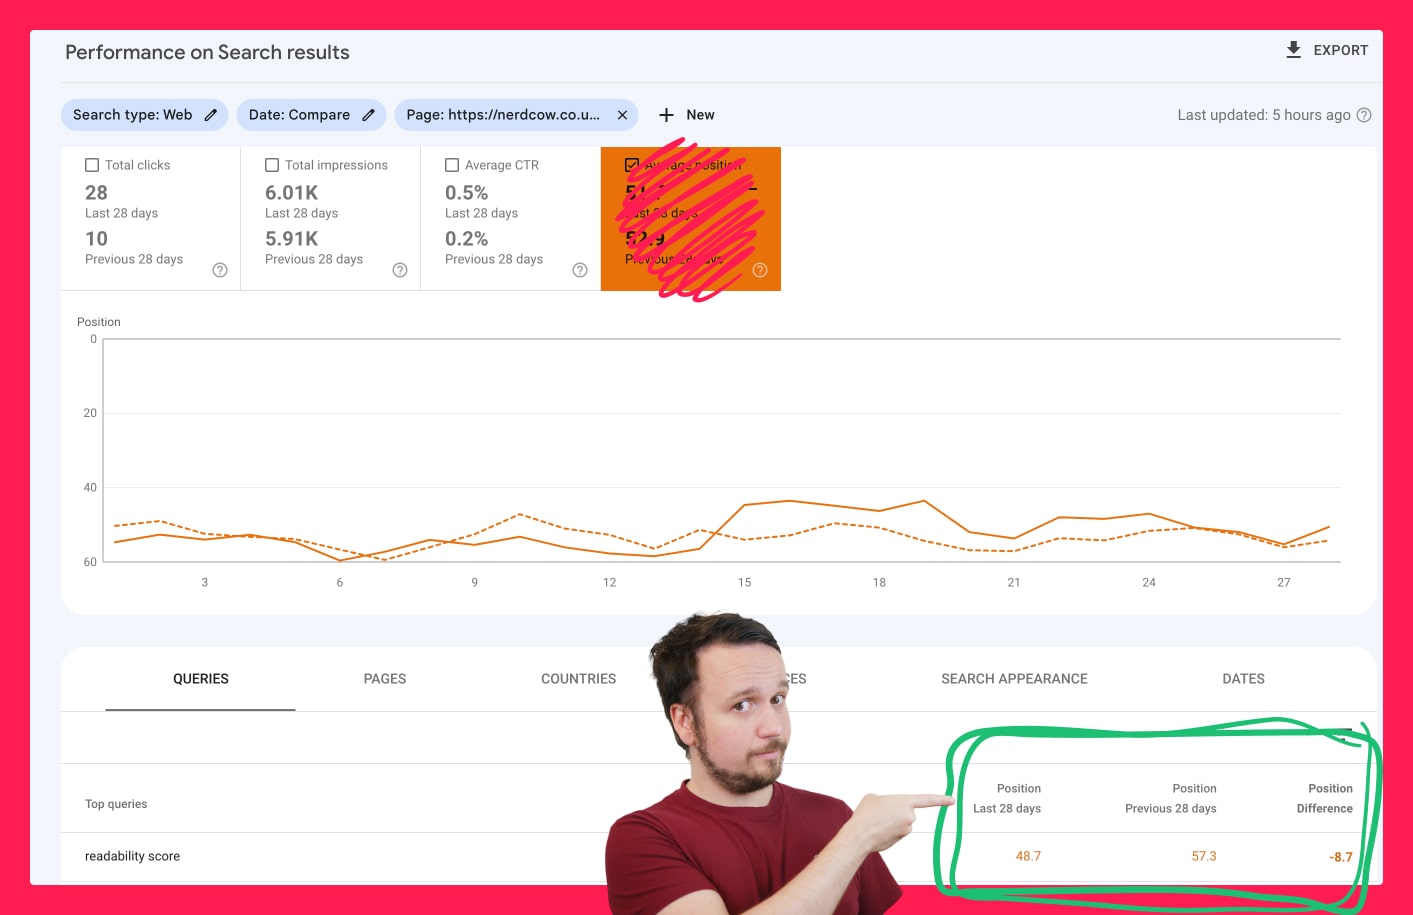
If your niche is “b2b customer service” and your position drops for that keyword, it’s a valuable signal from Google.
Meanwhile, you could improve for all your “money keywords” and still see the average position drop! 🤯 That’s because you’ll constantly rank for new keywords, lose old ones, significantly drop in position for irrelevant keywords that ranked accidentally… the list goes on and on.
Click-through rate is a valuable metrics in the right context. Considering it globally isn’t as bad, but we still encourage you to do heavy filtering before drawing conclusions from CTR changes.
4. SEO performance trends we look out for
- Click gains and losses
- Attributed clicks – some clicks go to searches that were not fully registered for privacy reasons. Because of that, the overall numbers can be unreliable.
- Impression gains and losses – overall and per page, keyword.
- Position gains and simultaneous impression/click losses – this generally means nothing is wrong with the page and it might be a fluctuation in search volume.
- Impression/click gains and position losses – a reverse of the previous example is usually a negative signal. Although there are scenarios where ranking at the top of the previous page is better than being at the bottom of the next one, you should always aim to improve your rankings.
- Overall click drops paired with attributed click gains – attributed data is more valuable than overall data. When you lose clicks, double-check if you didn’t gain attributed clicks at the same time. It might influence how you interpret the data.
- The position of top keywords (overall or per page)
- New keywords – when comparing to previous period, filter for a previous period position equal to zero
- Lost keywords – like above, but filter for current period position equal to zero
- Keyword relevancy – the biggest gains can happen for irrelevant keywords, and the biggest losses can be attributed to keywords you don’t want to rank for.
- Semi-relevant keywords – these rarely work for the current article, but can have great potential as a new piece of content.
5. How we document our SEO progress
To put it bluntly, we make it as approachable as possible. Just a few sentences with statistics and conclusions, as and when needed.
Here’s an example:
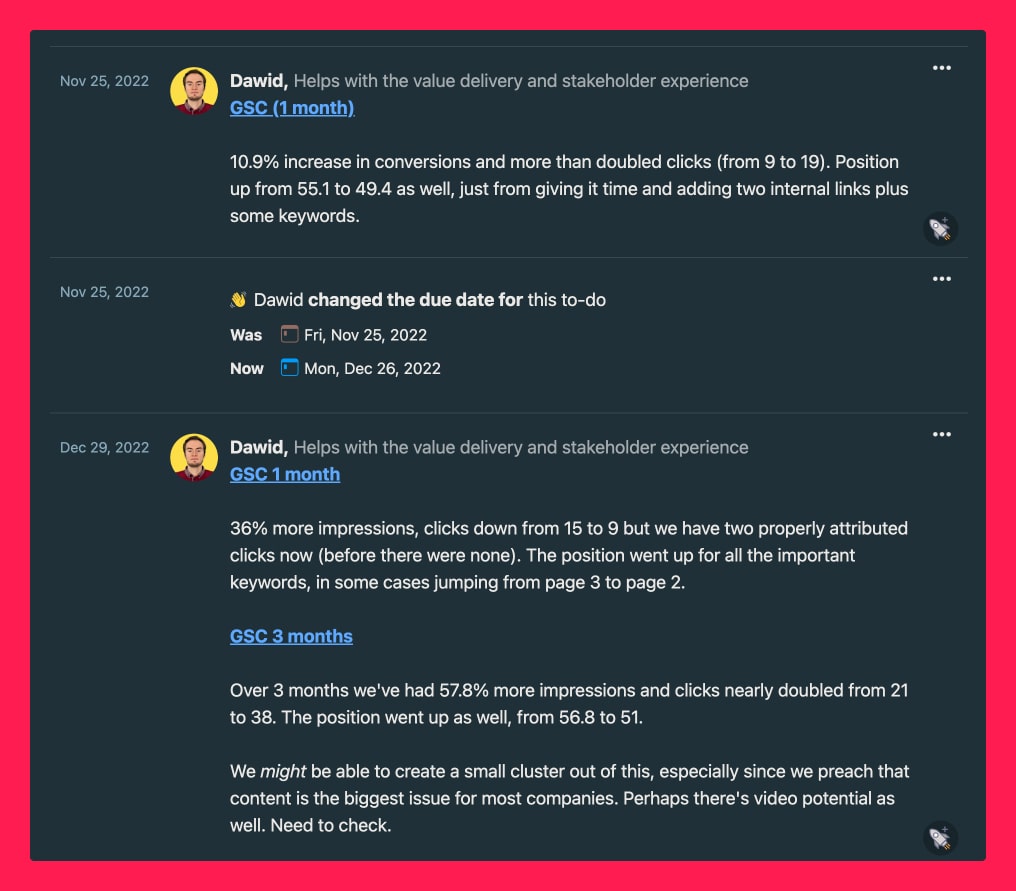
Consistency is key.
We always include links to relevant Search Console reports.
Our summaries often refer back to the previous month’s findings.
It sounds like a cliché, but SEO is a long-term game. You need to have as much context as possible to make an educated decision.
6. The extra step: how we check engagement for organic content
This step came later in the process. What you’ve seen so far is enough to get started.
But how visitors read the articles after they find it. We weren’t sure if we’re attracting the right traffic to our blog and this is how we answered the question.
First, we used Google Analytics. Back then, it was still the old version but GA4 is good as well.
I’d say it’s even better to start, because you get the aggregated engagement metric. We didn’t need to dive deeper than that. It was more important to observe trends. Is our engagement going up or down? Is it relatively high or low? (The answer to the last question is “it depends”, but 60-75%+ engagement rate is considered healthy.)
The second option is using heatmaps and recordings. You can choose tools with a free plan, like Hotjar, or use the completely free Microsoft Clarity. The insights from these tools goes way beyond what analytics can show you, but analysing the data takes more time and effort.
Consistency is key when tracking SEO performance
A single article can get a spike of traffic for 3 months, and then plummet. That’s because Google is “testing the waters” to see if they got the intent right. They push the article harder initially to see whether people interact with it enough, and then the traffic normalises.
A drop after that initial period isn’t unusual, and doesn’t always mean the article is bad. Especially for competitive keywords, it will take time to rank high. That initial boost will see impressions many times higher than what you should expect, so treat it as such, rather than the article being disappointing.
Google also makes changes to the Search algorithm multiple times a year.
As a marketer, you don’t need to stay on top of things. But it’s useful to have a simple process that helps you detect anomalies. You can use these insights to flag it internally or ask your agency for help.
With quick and easy access to your SEO results, you can correct the course of your content strategy as early as possible.
Originally published Aug 22, 2023 1:17:19 PM, updated November 6 2025.

